SQL Server
Phase 01, Pre-MBASQL Business Analysis: Sales Performance
Using SQL Server and AdventureWorks data to compare online and offline sales performance from 2011 to 2014.
I used SQL Server to explore sales data from the AdventureWorks sample database, comparing online and offline sales between 2011 and 2014. I wanted to answer a simple question: how did sales performance change between 2011 and 2014, and how did online and offline sales compare?
SQL query
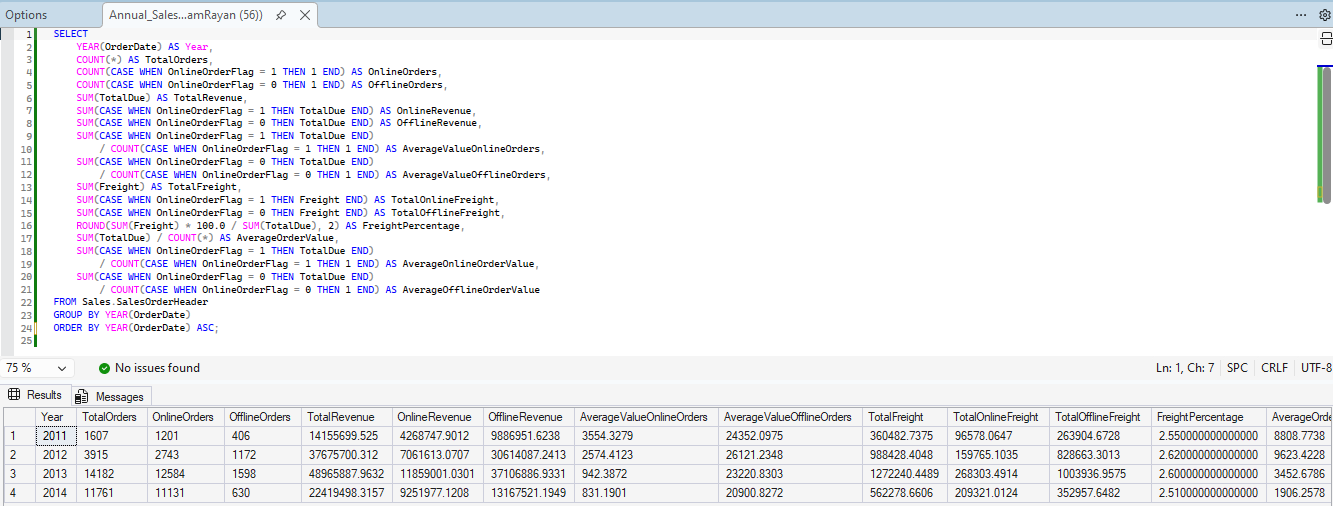
SELECT YEAR(OrderDate) AS Year, COUNT(*) AS TotalOrders, COUNT(CASE WHEN OnlineOrderFlag = 1 THEN 1 END) AS OnlineOrders, COUNT(CASE WHEN OnlineOrderFlag = 0 THEN 1 END) AS OfflineOrders, SUM(TotalDue) AS TotalRevenue, SUM(CASE WHEN OnlineOrderFlag = 1 THEN TotalDue END) AS OnlineRevenue, SUM(CASE WHEN OnlineOrderFlag = 0 THEN TotalDue END) AS OfflineRevenue, SUM(CASE WHEN OnlineOrderFlag = 1 THEN TotalDue END) / COUNT(CASE WHEN OnlineOrderFlag = 1 THEN 1 END) AS AverageValueOnlineOrders, SUM(CASE WHEN OnlineOrderFlag = 0 THEN TotalDue END) / COUNT(CASE WHEN OnlineOrderFlag = 0 THEN 1 END) AS AverageValueOfflineOrders, SUM(Freight) AS TotalFreight, SUM(CASE WHEN OnlineOrderFlag = 1 THEN Freight END) AS TotalOnlineFreight, SUM(CASE WHEN OnlineOrderFlag = 0 THEN Freight END) AS TotalOfflineFreight, ROUND(SUM(Freight) * 100.0 / SUM(TotalDue), 2) AS FreightPercentage, SUM(TotalDue) / COUNT(*) AS AverageOrderValue, SUM(CASE WHEN OnlineOrderFlag = 1 THEN TotalDue END) / COUNT(CASE WHEN OnlineOrderFlag = 1 THEN 1 END) AS AverageOnlineOrderValue, SUM(CASE WHEN OnlineOrderFlag = 0 THEN TotalDue END) / COUNT(CASE WHEN OnlineOrderFlag = 0 THEN 1 END) AS AverageOfflineOrderValueFROM Sales.SalesOrderHeaderGROUP BY YEAR(OrderDate)ORDER BY YEAR(OrderDate) ASC;What I Found
Total orders grew by around 7.3 times between 2011 and 2014. The biggest jump occurred between 2012 and 2013, when order volume increased by approximately 3.6 times. In 2014, however, total orders fell by about 17%.
Online orders grew from 1,201 in 2011 to 11,131 in 2014, an increase of more than nine times. Offline orders followed a different pattern: they increased initially, but by 2014 their annual volume was much closer to the 2011 level.
Revenue followed a more surprising trajectory. It increased substantially from 2011 to 2012, rose by around 30% in 2013, and then dropped by approximately 54% in 2014. The decline was much sharper than the fall in order volume, making 2014 particularly interesting to investigate.
Another finding was the difference between order volume and revenue across the two channels. Online orders were much more numerous, but offline sales generated more revenue in every year analyzed. In 2014, offline revenue was about 1.4 times online revenue, compared with approximately 3.1 times in 2013.
This difference was also reflected in average order value. Offline orders had a substantially higher average value than online orders throughout the period, although average order value declined in both channels in 2014.
Freight costs added another dimension to the comparison. Total offline freight was higher than online freight in every year, but the gap narrowed considerably by 2014. This was worth exploring alongside the growth in online orders and the narrowing revenue gap.
Key Insights
- Growing online sales could help close the revenue gap.
My hypothesis is that greater investment in the online channel, combined with efforts to increase average order value, could help online revenue approach offline revenue. This would mean focusing not only on attracting more online orders, but also on increasing the value generated by each order.
- The opportunity depends on the economics of each channel.
Offline sales generated more total freight costs, but this does not necessarily mean online orders are cheaper to fulfill on a per-order basis or more profitable overall. I would investigate the full cost structure of both channels to determine whether growing online sales while controlling fulfillment costs could improve profitability.
- The 2014 revenue decline deserves a closer look.
The difference between the decline in revenue and the smaller decline in order volume suggests that order count alone does not explain the change. My next step would be to examine product-level sales, pricing, discounts, and average order values to identify the factors behind the decline and determine whether it reflects a change in customer behavior or product mix.
This project gave me an opportunity to practice SQL in a business context, identify patterns in transactional data, and turn those patterns into questions for further analysis.
What I practiced
Project
Download SQL query
Download SQL Query (.sql)↓