Excel
Pre-MBAExcel: Financial Data Analysis
Building a transaction-level financial model to analyze spending patterns, cash flow, and financial performance.
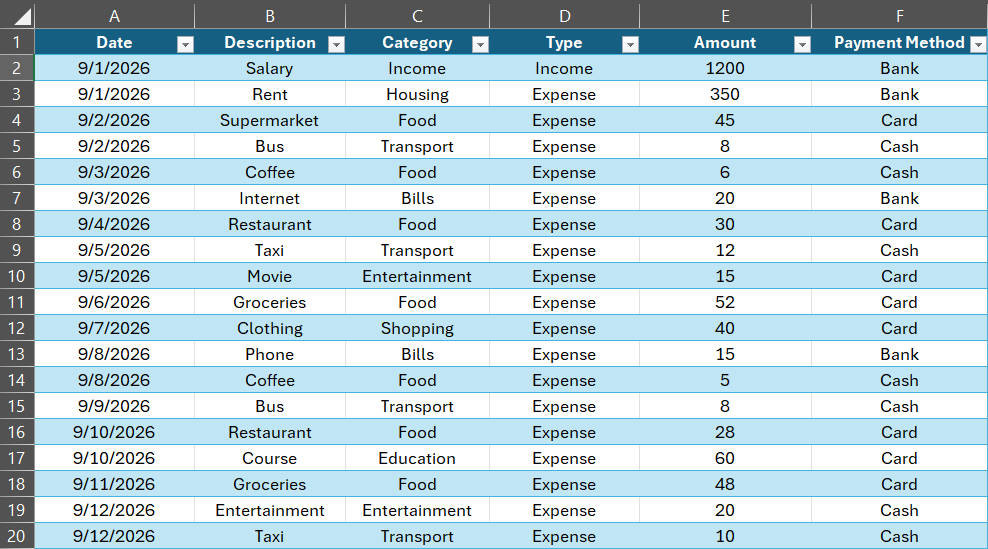
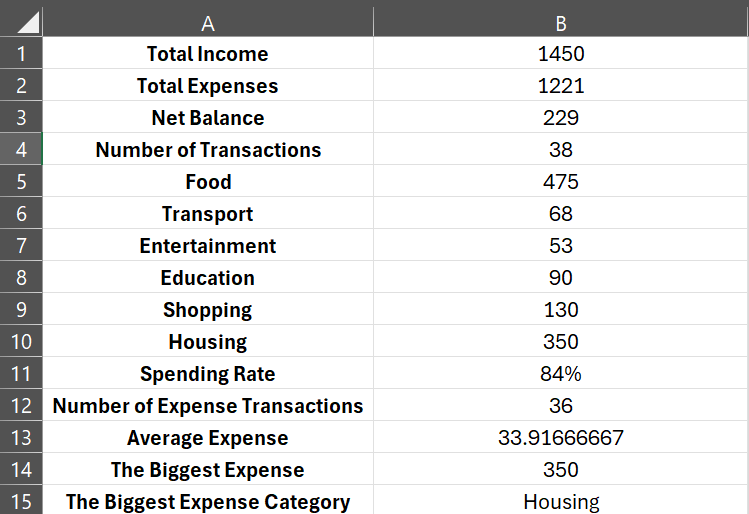
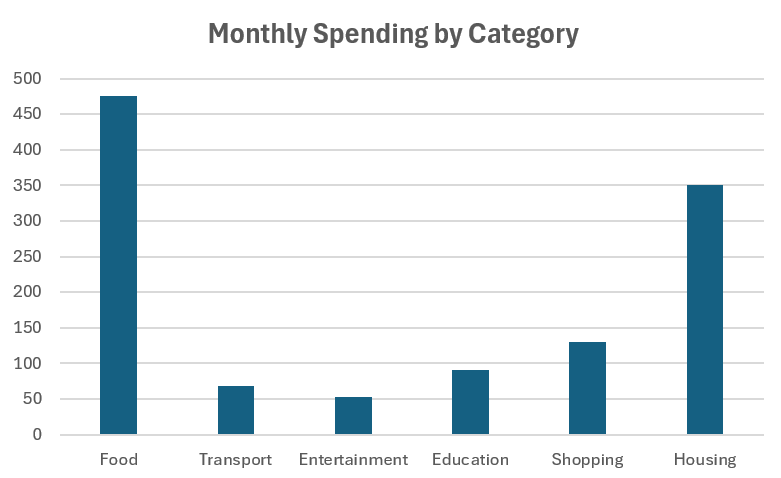
I built this project as a small transaction-level financial model in Excel. The workbook starts with a structured transaction table and turns it into a financial summary covering income, expenses, net balance, spending by category, transaction counts, average expense, and the largest expense. The goal was to practice moving from raw financial data to calculations and then to a clearer view of financial performance.
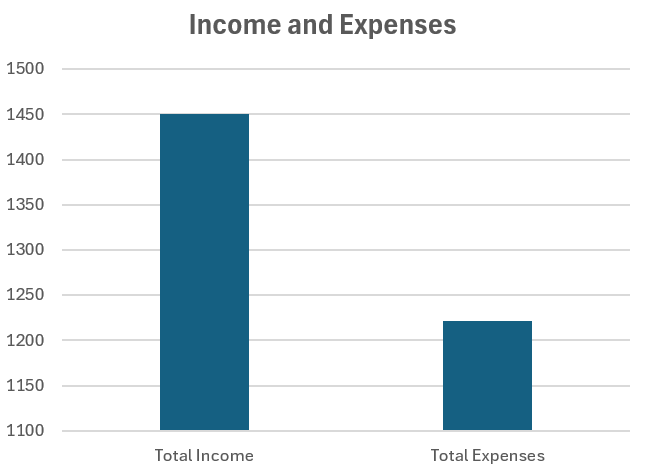
The project also gave me a chance to practice Excel formulas in a real, connected model rather than as isolated exercises. The summary calculations use criteria-based functions and lookups against the transaction table, while charts make some of the results easier to interpret.
What I practiced
Project
Explore the model
Want to see how the model works? Open the original workbook and explore the formulas, calculations, and underlying transaction data.
Download the Excel file↓